This Annex provides a generic overview of the process that may be followed when assessing the risk to an Australian Defence Force (ADF) aircraft fleet when a notable propulsion system related hazard is identified. This Annex ostensibly supports the broader risk management process that would underpin the response to an unsafe condition associated with a propulsion system design or manufacturing deficiency, or a certification shortfall.
This Annex provides guidance to understand a Risk Analysis (RA) generated by a propulsion system Original Equipment Manufacturer (OEM) and identifies the key steps the operator should consider when characterising technical risk as part their 7-step risk management process. This Annex does not provide tools or equations to conduct a RA11.
In the event of a propulsion system related component failure, in particular one that would lead to an unsafe condition22, it is imperative to understand the failure mechanism and the risk that additional failures may pose to ongoing and future ADF operations.
Due to typically high production, repair, and replacement costs, and potential logistics constraints for propulsion system components, the operator may be required to operate an aircraft fleet at a higher risk for a period of time. In order to continue operations, the risk must be eliminated or otherwise minimised So Far As is Reasonably Practicable (SFARP) and retained at the appropriate level. In order to characterise the risk to the ADF fleet and conduct a robust RA, adequate information on the failure mechanism, understanding the population at risk, failure rate data, propulsion system usage, maintenance history and propulsion system component life distributions are required. Generally, type design data access limitations will mean that the engine OEM conducts the RA for the ADF; however this may not always be the case.
When attempting to characterise the risk of a propulsion system related hazard that may lead to a hazardous propulsion system effect33, DASA recommends using an approach aligned with FAA AC39–8 - Continuing Airworthiness Assessment Methodology, in combination with appropriate engineering judgement and consideration of individual operator context, to identify and assesses strategies to eliminate or otherwise minimise the hazard SFARP44. The approach outlined in AC39-8 is well understood by industry and is used by engine OEMs globally to manage propulsion system related hazards and communicate risk to the relevant regulators and operators. Further guidance on understanding the conduct of risk analysis for propulsion systems can be found within the FAA Risk Analysis Correspondence Course.
The Defence Harmonised Risk Matrix (DHRM) and aircraft System Safety Programs (SSP) are focused on the instantaneous or average risk to the fleet at the point in time the risk was calculated. They usually do not fully account for the future utilisation of the fleet or the risk associated with any mitigation strategies that may be utilised to minimise the risk across an extended campaign. As propulsion system related hazards may take a relatively long time to remediate and often involve complex interim risk controls, DHRM or the SSP should not be used as the sole mechanism to characterise the risk.
There is no ‘one size fits all’ approach to risk management and not every identified hazard requires the conduct of a detailed risk analysis as outlined in the following steps. The following approach provides guidance on the process that should be followed in order to conduct a more detailed RA for a hazard that has been identified as complex, or requires risk to be retained for an extended period. RAs are only approximations based on the information available at the time. As such, good engineering judgement and a pragmatic approach should be used when an RA is performed.
Typical propulsion system failure investigations can often take months to identify root cause and contributing factors. As such, in order to support Commanders in the short-term, a simple RA should be conducted in order to determine the immediate risk to the ADF fleet. It would require ADF, and if applicable, global fleet life usage data of the affected component (i.e. Time Since New, Time Since Overhaul, engine cycles, number of global failures). The RA should be conducted at the aircraft level using a method consistent with the platform SSP, in order to quantify the immediate risk to the fleet where the likelihood value would be defined as failures ‘per AFHR’ or ‘per ENHR’. The likelihood value and the consequence of the failure are then applied to the platform SSP to generate a system safety Hazard Risk Index (HRI). The calculated HRI and any other applicable technical data related to the failure should be provided to the operator to support the operator’s risk management process.
To support an initial decision regarding the risk to continuing ADF operations, the operator should use the risk management process applicable to their platform (usually DHRM) to make an initial determination whether to continue operation. This is expected to be informed by knowledge of the event, the initial HRI, available technical data, and available technical and operational risk controls. It is likely that technical data, such as root cause or identification of an ‘at risk’ population will not be known at this time and therefore specialist judgement will be required.
Once more information on the failure mode is available, and it is identified that the hazard is likely to manifest in other aircraft, a detailed RA should be conducted to enable a more accurate estimation of the likelihood of a similar failure occurring in the future. This is generally developed once more data is gathered by the organisation conducting the RA on the global fleet and individual fleet usage statistics. OEMs will usually be heavily engaged in developing detailed RAs for propulsion systems, and therefore are the usual, but not only, source of RA data55.
A detailed RA for propulsion system issues usually involves the following steps:
Inputs to detailed RA. When conducting an RA, a representative dataset of the affected component should be compiled. It would include the current fleet life distribution of the suspect pool of components, life accrual details of the failed components and any data associated with the failure mechanism of the component.
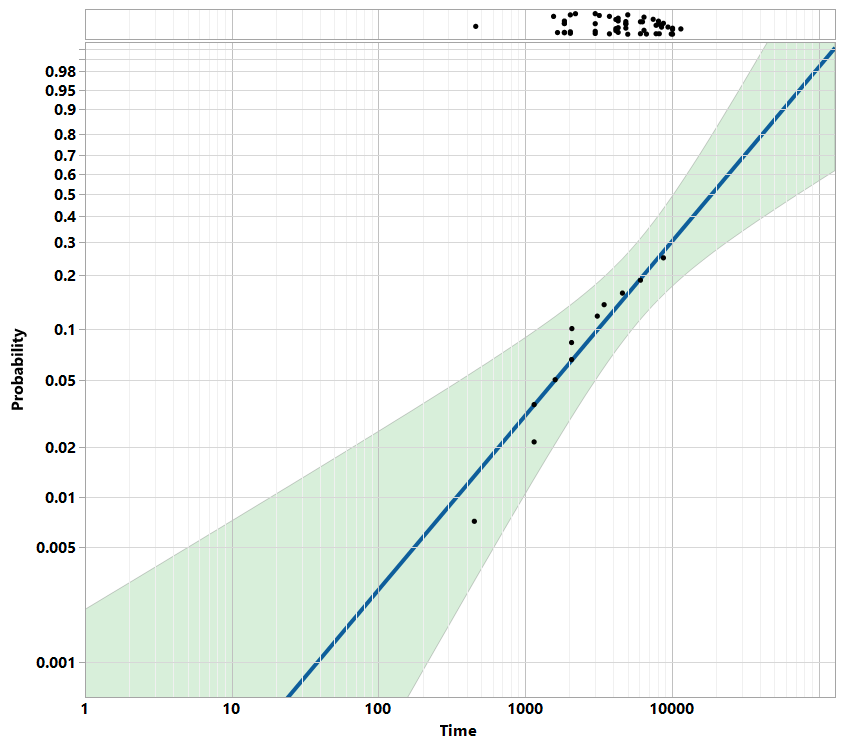
Developing a Representative Statistical Distribution. Utilising the dataset from step 11.a, a statistical distribution (i.e. Weibull, lognormal, etc., depending on the failure characteristics and dataset) should be generated. A Weibull plot (see Figure 1) is commonly used in industry to model failure data, although other statistical methods may be used by the OEM (or organisation conducting the RA) depending on their processes or the failure mechanism. The Weibull plot typically represents time to failure or another similar usage parameter on the x-axis versus cumulative failure probability for the component population on the y-axis. The Weibull distribution is typically defined by two parameters: the shape parameter, called the ‘slope’ or β, and the scale parameter, also called the ‘characteristic life’, θ or η (note these symbols may vary). These parameters define the specific component failure distribution and corresponding plot.
Figure 1 - Example Weibull Chart
Develop the Cumulative Density Function (CDF). Based on the statistical distribution generated in step 11.b, a failure probability curve (also referred to as the CDF curve or per part probability of failure curve) should be produced for the affected part. The cumulative probability of failure from time zero until a given time is displayed by this curve and is used to estimate the proportion of components that will fail over a period of time. The y-axis of the CDF curve ranges from 0-1 (or 0%-100%) and is a probability value. Generally, the OEM may only provide an excerpt of the CDF to align with the current life limit of the affected component as shown in Figure 2 below.

Figure 2 - Weibull CDF Curve
Validate Weibull & CDF Curve. Having produced a statistical model, it is important that the model be validated against the real world understanding of the problem. This is often achieved by calculating the historical predicted number of events (PNE) and comparing that to the actual number of events experienced to date. The PNE for the fleet is calculated by summing all the individual component probabilities of failure calculated from the CDF curve. Where there is significant difference between the statistical model and actual fleet experience, the assumptions, data and model type may need to be revised. When using PNE as part of the risk assessment process, it is important to understand the following:
The PNE cannot be translated directly to a probability of failure (%). Using the PNE (ϕ) for the ADF fleet at any point in time, the probability that a discrete number of failures (x) will have occurred in the fleet can be calculated using the Poisson distribution as follows

For example, if the PNE for affected components to-date was calculated to be 0.33, the probability of having an ‘X’ event up until the point of calculation is detailed within Table 1 below:
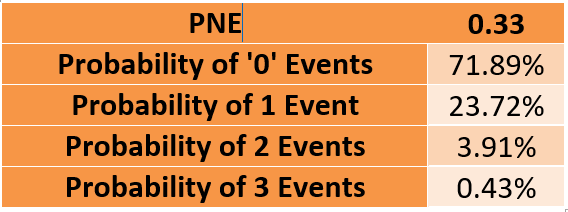
Table 1 - Historical PNE depicting the probability of events occurred to-date
Develop a Fleet Management Strategy. As previously identified, elimination of a propulsion fleet hazard can take years to implement, especially if a change to type design is required or there are considerable logistics constraints. As such, the operator supported by the relevant engineering, logistics and maintenance organisations will need to develop a fleet management strategy to eliminate or minimise the risk SFARP. Fleet management strategies usually include requirements for minimum aircraft availability, expected rate of effort (ROE), maintenance capacity and turnaround times, interim or final airworthiness / inspection limit reductions, and any other relevant logistics or operational constraints. When developing a fleet management strategy, it is common for multiple scenarios to be developed to examine the corresponding risk, cost and operational impact. The time period where the ADF fleet is exposed to an elevated level of risk, as predicted by the fleet management strategy, is defined as the campaign period.
Determine Future PNE. Utilising the CDF curve for the failure, the life usage distribution of the affected components and the assumed future utilisation rate(s) for the fleet, the future PNE can be calculated for the campaign period. A PNE estimate should be produced for every fleet management strategy scenario, including a ‘baseline’ scenario where no action is taken to mitigate the risk. This method has significant advantages over traditional average probability of failure based methods, as it enables the operator to understand how variations in operational requirements, logistics constraints, and engineering risk controls influence risk over the campaign period. Figure 3 provides an example of how the cumulative PNE for an example fleet varies based on different fleet management scenarios. This type of model can further inform the Risk Management Authority (RMA) when selecting a fleet management strategy that is SFARP, when balanced against contextual considerations (i.e. logistics, cost, time-to-implement, capability requirements).

Figure 3 - PNE Comparison
As per the example in Table 2 below, Poisson distribution must be used to convert the final PNE for each scenario into a probability of a discrete event (i.e. 0, 1, 2 … n events). This should be applied to each fleet management scenario to determine the likelihood of zero and non-zero events occurring over the campaign period.

Table 2 - Probability of 'X' Events Occurring During Campaign Period
Once this analysis is complete, each fleet management strategy scenario and the subsequent risk can be used to inform the risk characterisation step in the 7-step risk management process. This allows the RMA to understand the long-term risk for each scenario, and to allow for the adoption of a fleet management strategy that balances operational impact, cost and risk. Importantly, this approach does not replace an operator’s DHRM or SSP, but rather supplements those approaches with a method that provides increased visibility and understanding of risk drivers.
Monitoring Risk. Once a risk fleet management strategy has been implemented it is possible to track progress against that plan to support risk monitoring. Should there be notable deviations from the plan, further information relating to root cause, or changes to underlying assumptions identified, the RA should be revised. This includes changes to assumptions made when developing the fleet management strategy.
Risk management activities that warrant the use of this approach to characterise the risk of a propulsion system hazard would usually require retention of an elevated level of risk to aviation safety for a period of time. In these circumstances, the operator would normally seek independent safety assurance from DASA via the Military Permit to Fly (MPTF) process (refer DASR 21 Subpart P and DASP Manual Volume 3 Section 7.5 for further information). Alternatively, the risk analysis process outlined herein may support the proposed corrective actions for DASA to issue Airworthiness Directive (AD) (refer to DASR 21.A.3B and DASP Manual Volume 3 Section 7.4.3 for further information).
15. The Propulsion System Integrity (PSI) Section in DAVENG acts as the aerospace propulsion system integrity Centre of Expertise for Defence66, and can provide additional information and training on the RA methodology outlined within this Annex. PSI Section and DSTG can also assist with reviewing, interpreting and validating OEM RAs to determine if the methodology, assumptions and data used in generating the RA is appropriate.
Component (or part) risk. Risk from operating one of the parts of a particular type in the fleet; risk from operating a single component or part.
Cumulative Density Function, CDF – F(t). The cumulative probability of failure from time zero until time 𝑡. CDF is used to estimate the proportion of components that will fail over a period of time. It is also referred to as Per Part Probability of failure
Cumulative. Cumulative refers to failures or risk accumulated from a beginning time point to a later point; stated as total expected failures, etc.
Current risk. Today’s risk based on current in-service management practices.
Engine risk. Rollup of risk from all critical parts in one single engine, or rollup of risk from all modules in one engine.
Expected failures. The expected number of failures over an extended time (part life or age, calendar time, etc.); usually stated as failures or fractions of failures (0.0, 0.2, 0.4, 1.05, 2.0, etc.).
Failure rate. The expected failures or events over a specified time period, stated as expected failures per X hours, X cycles, etc.
Fleet risk. Rollup of risk from the total population of that critical part, or module or engine in the fleet.
Future risk. Risk projected at a later date based on current or alternate in-service management practices.
Hazard Rate. This is the instantaneous probability of failure per unit time. Instantaneous failure rate or we say instantaneous hazard rate
PoF. Probability of Failure
Predicted Number of Events, PNE. The estimated number of times an engine/component failure will occur in a given fleet expressed over a given campaign period. Also referred to as Expected Number of Events, ENE
Probability of occurrence or failure. The probability of 1 event (or more) occurring; stated as 0.0 to 1.0, or zero to 100%.
Risk analysis. A probabilistic method used to estimate, among other things, the expected number of ‘events’ (e.g. cracking, failure) in a given period of time and to estimate the probability of one ‘event’ or more occurring in that time period
Risk methodology. Statistical methods used to conduct the risk analysis. Typically, a Monte Carlo computer simulation model manipulates inputs such as part life distribution, part age histogram, and fleet operational data such as life limits, cycles or hours/month, maintenance scenarios, etc., to produce the above defined outputs. The statistical distribution of failures can be assumed as normal, log normal, Weibull, etc.
Weibull Parameters. For wear-out problems, the Weibull distribution will have a slope greater than 1, and values typically are in the range of 3 to 5, but may vary. A Weibull distribution with a slope equal or close to 1 reflects a random failure mode, and a slope of less than 1 is indicative of infant mortality
Defence Aviation Safety Regulations
DASA Propulsion Systems Integrity Section Website
ADF Propulsion Systems Engineering Course (PROPSYSENG)
FAA AC 39–8 - Continuing Airworthiness Assessment Methodology
FAA Risk Analysis Correspondence Course
DASP Manual Volume 3 Section 6.2 – Safety Management
DASP Manual Volume 3 Section 7.5 – Flight Conditions and MPTFs